Yunjiao Liu

Welcome to my small world of analytics! Or, you can call it a case playground!
My goal is be a creative,experienced marketing professional in the future!
View My LinkedIn Profile
View My Story
Analytics Design to Recommend Flavors New Product Line, Group Project
CASE BACKGROUND:
EarlyRiders, our client, had a recent management change and realized that their product set was underperforming. They currently offer two products and one in particular was not doing well. The management team decided after much deliberation to revitalize their product portfolio based on the opinions of potential end-users.
For this purpose, we ran a conjoint analysis based on 200 individuals, these individuals are made up of parents of 2-4 year old kids who planned to purchase a toy horse. And we were in charge of analyzing the data and creating a presentation to give to the management team of EarlyRiders.
:anguished:Too much? Don’t want to read anymore? Click the Easy Going PowerPoint Here
Analytics Design
Decision: Which product line based on long term profitability
Decision Criteria:
- Expect profit (Completely New or Adjust Current) v.s. Current product line (Expected)
- Clustering Output (Segmentations)
- Market share simulation
- Scenario, Possibility of Product Line, Influenced by clustering
Attributes
- From Survey: Gender, Age
- From Products: Size, Motion, Style, Price
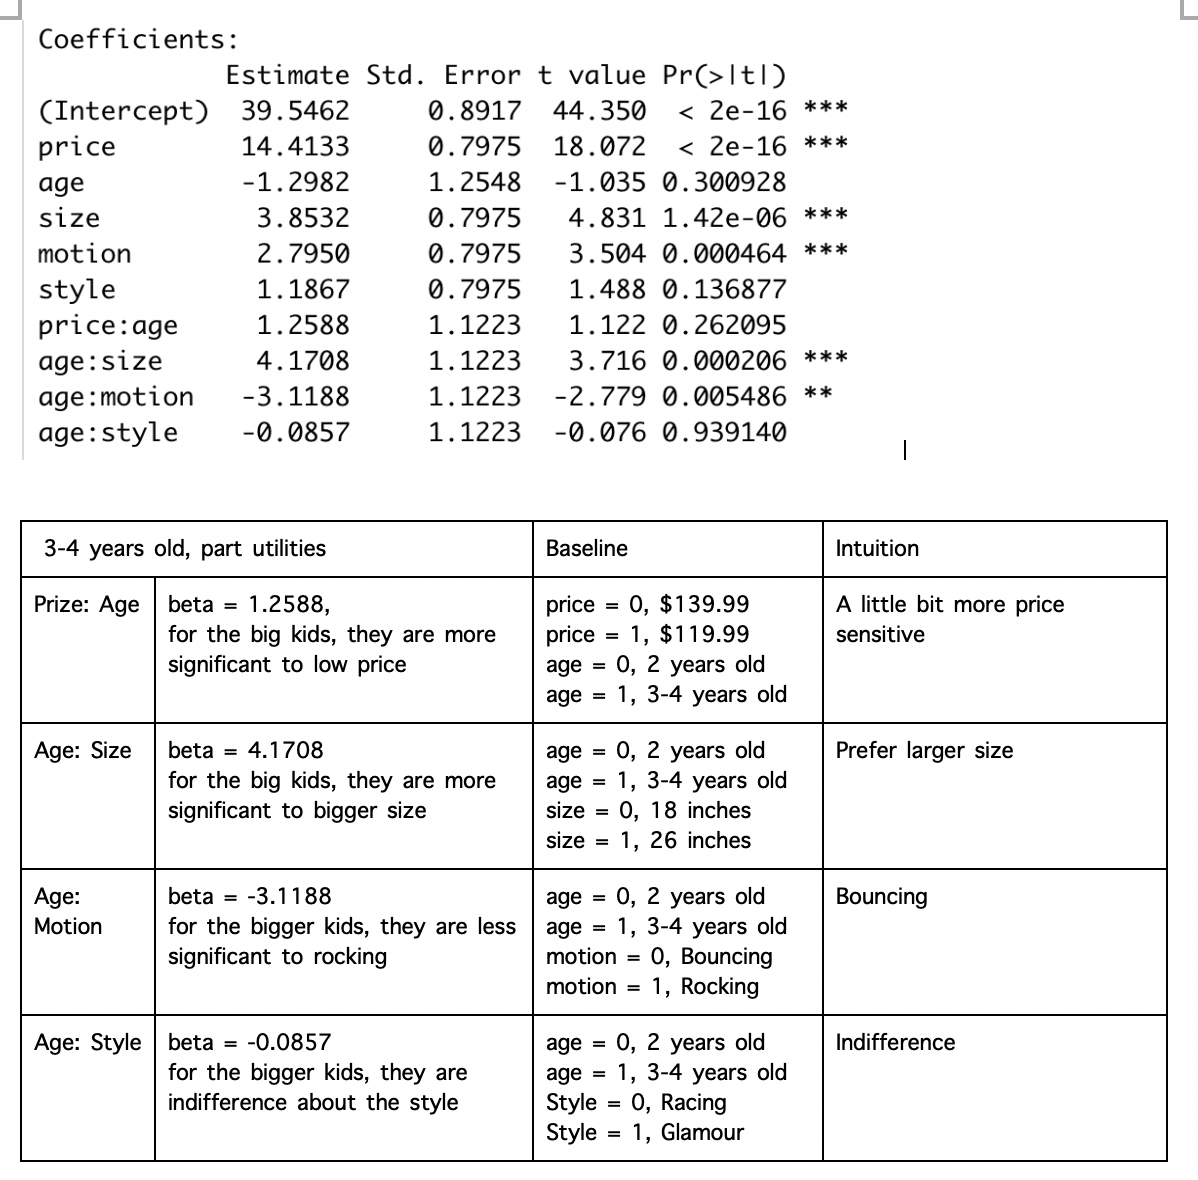
Priori Segment by “Age”
summary (lm(ratings~priceage+sizeage+motionage+styleage, data=prioridf))

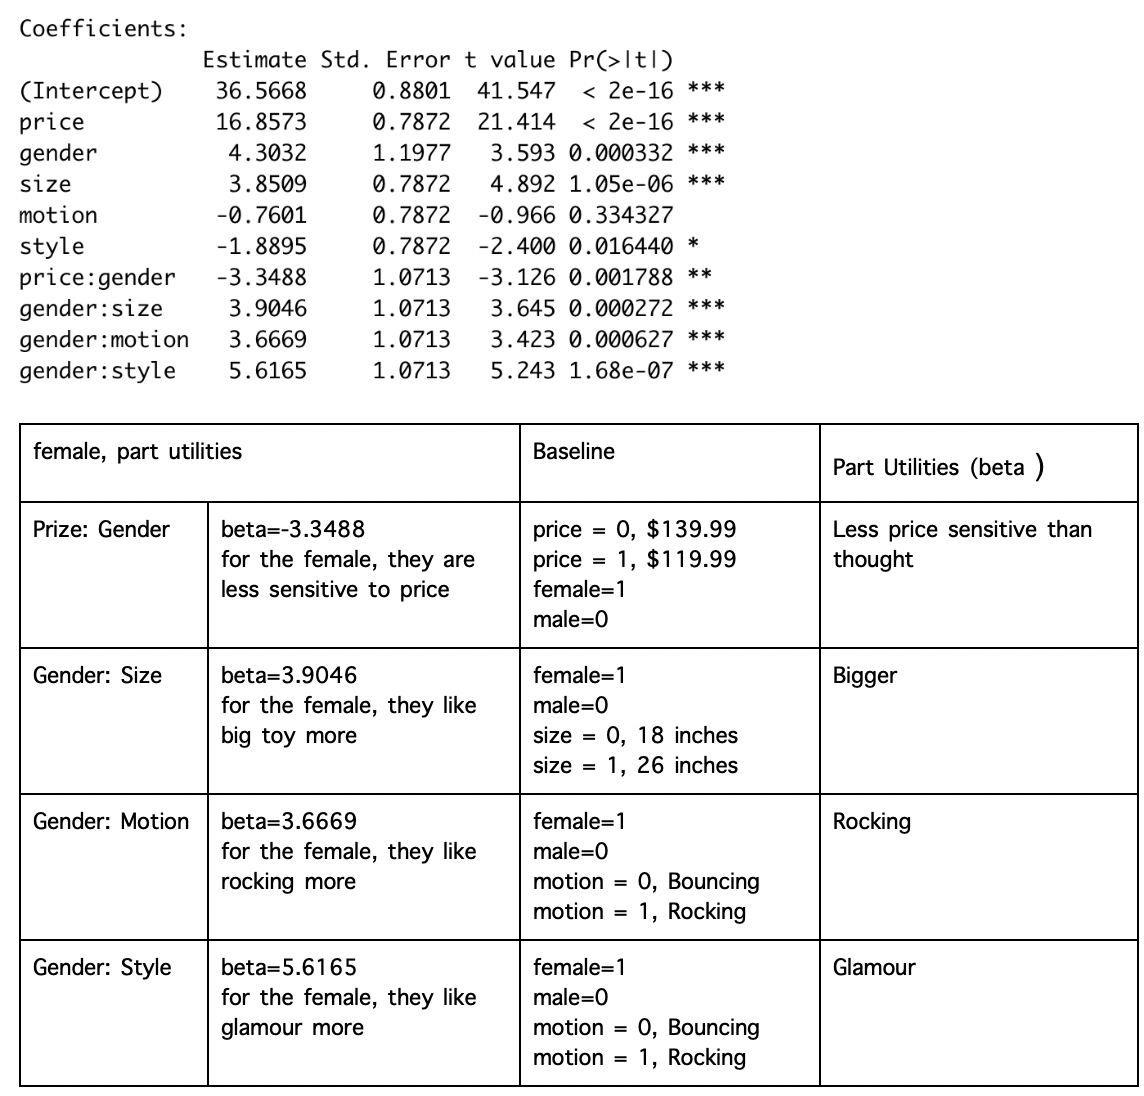
Priori Segment by “Gender”
summary (lm(ratings~pricegender+sizegender+motiongender+stylegender,data=prioridf))
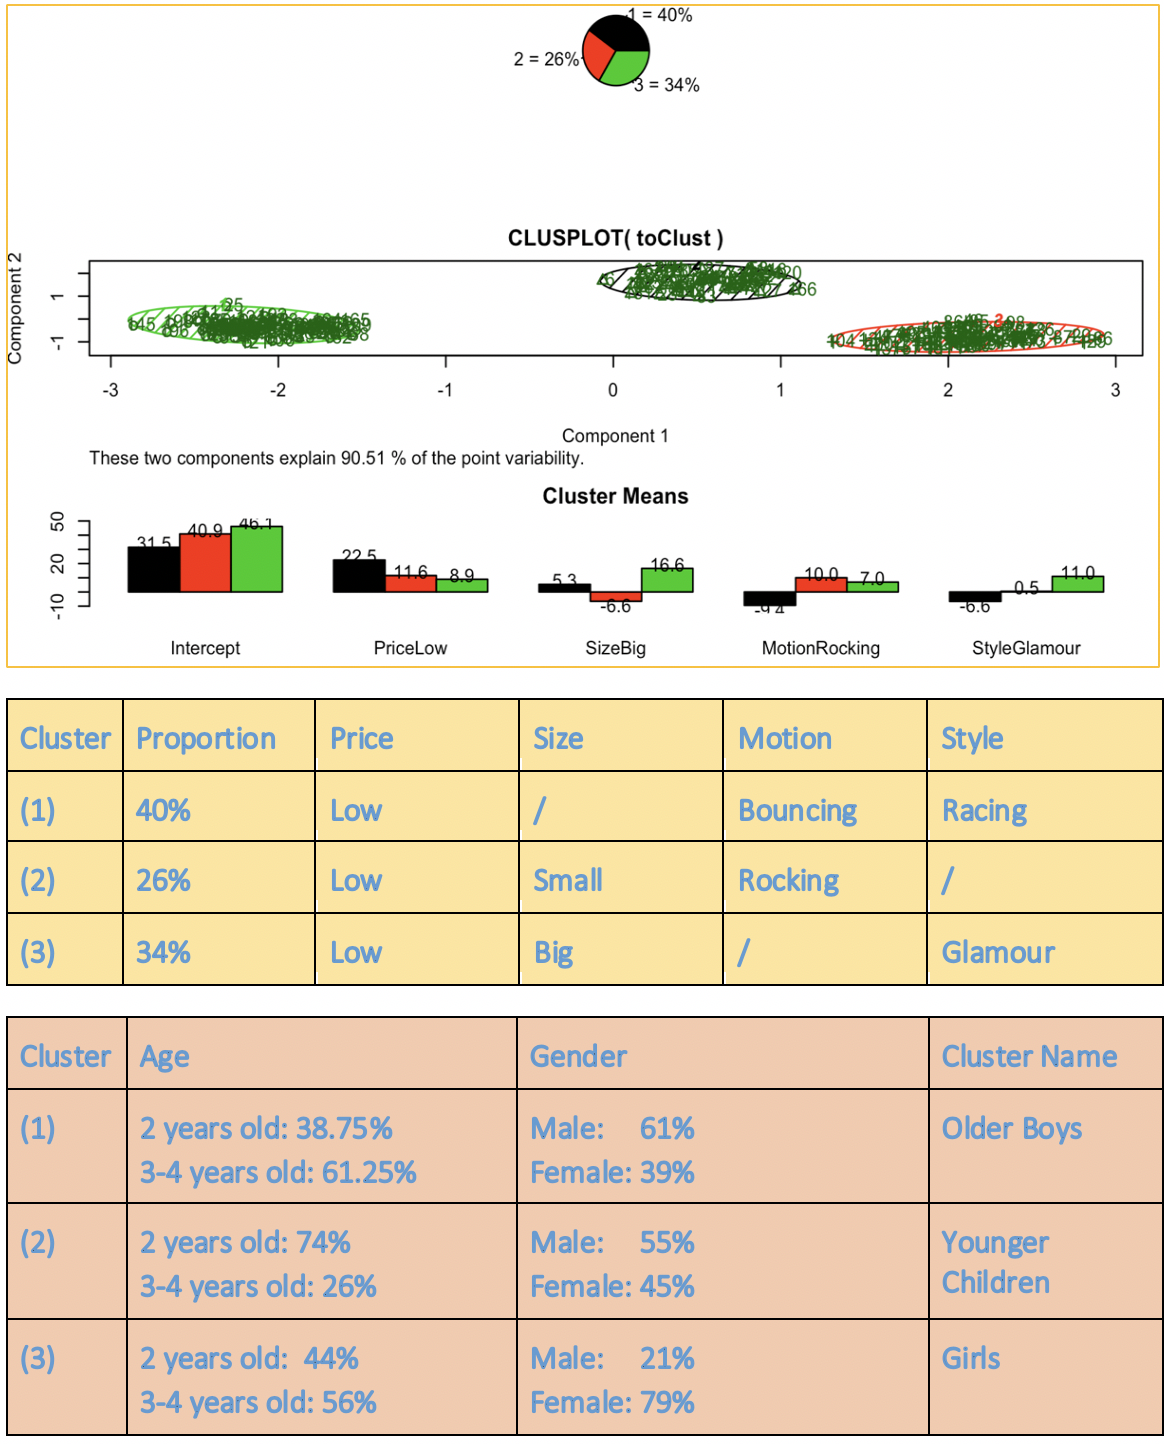
Post Hoc: Cluster Modeling
3 segments supported by average silhouette Total within sum of square–visual intuition

4. R Code
5. Profit Analysis
Considerations for Longterm Profit:
- steady product line
- change with response to competitors Here to know -> Game Theory
- change price
- shrink/expand product line
Why data is so important to pricing? Here to know–>Amazon does not use Price Match Guarantee
